
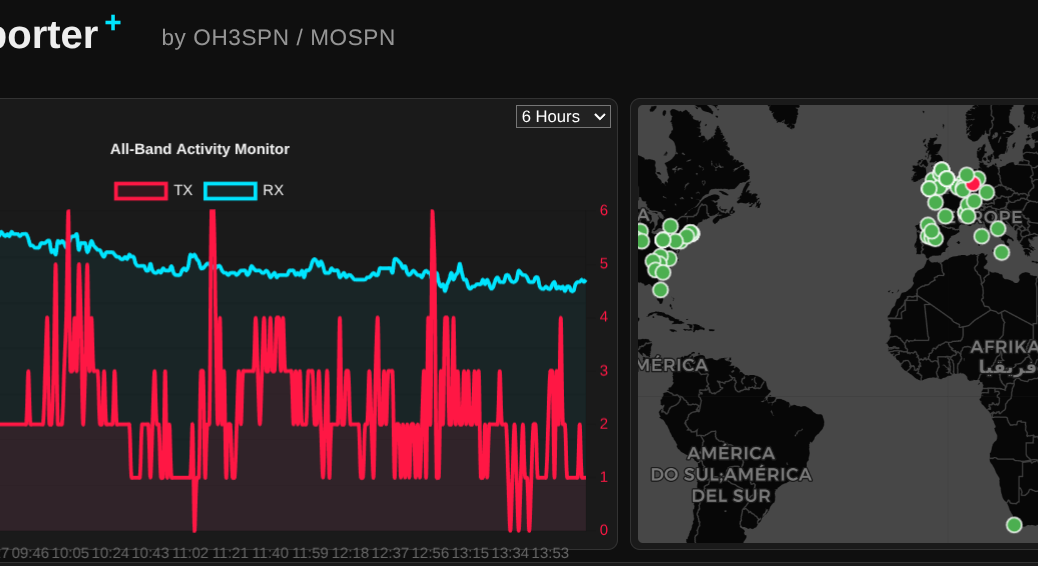
What happens when you combine an NVIDIA RTX 3060, an open-weight 14-billion parameter LLM, and a global network of amateur radio operators? You get a surprisingly perfect example of edge computing.
Continue reading From the Ham Shack to the Edge: Delivering Real Value with Local LLMsCategory Archives: openshift

What I Learnt Giving an LLM Agent Control of My Crypto Wallet

In my role as a Senior OpenShift Technical Account Manager at Red Hat, I focus on mission-critical stability; helping organisations navigate the shift from cloud-native architectures to AI-ready operations. But there is a distinct difference between advising on a scalable MLOps workflow and trusting a local LLM to trade your own capital in a volatile market.
Would you trust an AI agent with your bank account? I did; and it was a masterclass in ‘Boom or Bust’ logic.
Continue reading What I Learnt Giving an LLM Agent Control of My Crypto Wallet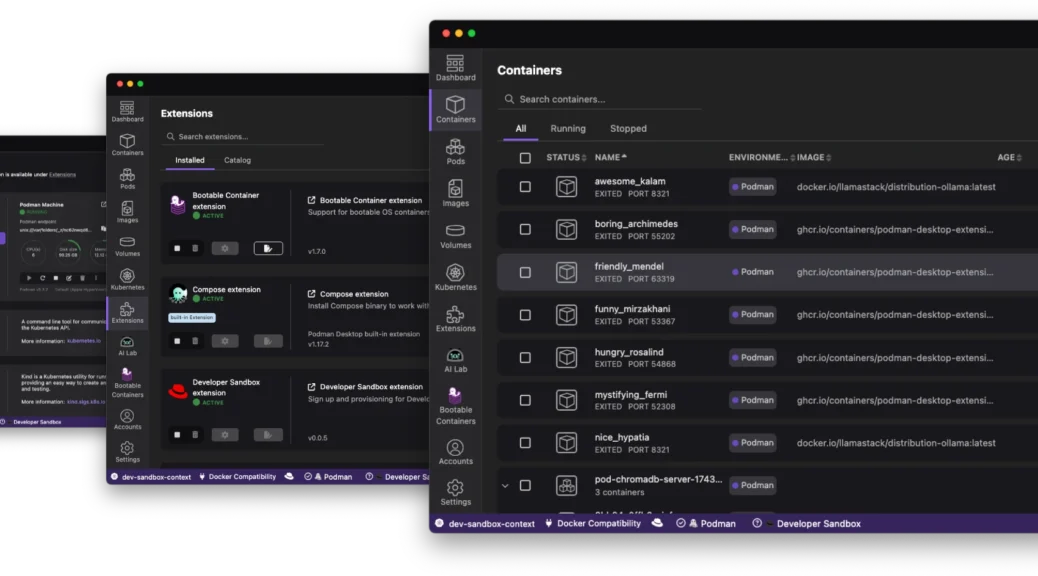
Navigating the Future of Local Development: The Red Hat Build of Podman Desktop
The “it works on my machine” excuse has officially reached its expiration date. As we move through 2026, the complexity of modern applications – often involving a mix of containers, Kubernetes manifests, and now local AI models – demands a local environment that is not just a sandbox; it is a mirror of production.
Enter the Red Hat build of Podman Desktop.
Continue reading Navigating the Future of Local Development: The Red Hat Build of Podman DesktopFrom Zero to Openshift in 30 Minutes
Discover how to leverage the power of kcli and libvirt to rapidly deploy a full OpenShift cluster in under 30 minutes, cutting through the complexity often associated with OpenShift installations.
Continue reading From Zero to Openshift in 30 MinutesOpenShift: How to determine the latest version in an update channel.
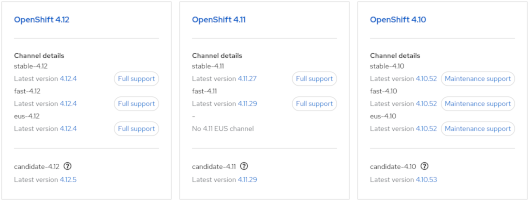
- Visit https://console.redhat.com/openshift/releases
or - Visit the Red Hat OpenShift Container Update Graph at https://access.redhat.com/labs/ocpupgradegraph/update_channel
- Using the CLI (curl & jq):-
curl -s https://api.openshift.com/api/upgrades_info/v1/graph?channel=stable-4.11 | jq -r '.nodes[].version' | sort -V | tail -n1
Also, to check available upgrade edges:-
curl -s -XGET "https://api.openshift.com/api/upgrades_info/v1/graph?channel=stable-4.11" --header 'Accept:application/json' |jq '. as $graph | $graph.nodes | map(.version == "4.10.36") | index(true) as $orig | $graph.edges | map(select(.[0] == $orig)[1]) | map($graph.nodes[.]) | .[].version'
Further examples can be found at https://access.redhat.com/solutions/4583231
GlusterFS / VG Metrics in Prometheus (OCP)
We had a requirement to gather LVM (VG) metrics via Prometheus to alert when GlusterFS is running low on ‘brick’ storage space. Currently, within Openshift 3.9 the only metrics seem to relate to mounted FS. A ‘heketi exporter module’ exists but this only reports space within allocated blocks. There doesn’t appear to be any method to pull metrics from the underlying storage.
We solved this by using a Prometheus pushgateway. Metrics are pushed from Gluster hosts using curl (via cron) and then pulled using a standard Prometheus scrape configuration (via prometheus configmap in OCP). Alerts are then pushed via alertmanager and eventually Cloudforms.
Import the pushgateway image:
oc import-image openshift/prom-pushgateway --from= docker.io/prom/pushgateway --confirm
Create pod and expose route. Then, add scrape config to prometheus configmap:-
    - job_name: openshift-pushgateway

      scrape_interval: 30s

      scrape_timeout: 30s

      metrics_path: /metrics

      scheme: http

      static_configs:

      - targets:

        - pushgateway-route.example.com
On GlusterFS hosts we then gather metrics in whatever way we like and push to the gateway via curl. Example:-
echo "VG_Gluster 42" | curl --data-binary @- http://pushgateway-route.example.com/metrics/job/pv_mon/pv/vg"
The metrics are then visible via prometheus UI / Grafana and alerts via alertmanager and CFME respectively.
Gnome 3 (Fedora 27) Screen Lock Timeout
Gnome 3 doesn’t appear to offer any GUI control over the screen lock timeout.
So, to get current values:-
[snetting@lapper ~]$ gsettings get org.gnome.desktop.session idle-delay

uint32 300

[snetting@lapper ~]$ gsettings get org.gnome.desktop.screensaver lock-delay

uint32 0
And to set:-
[snetting@lapper ~]$ gsettings set org.gnome.desktop.session idle-delay 600
idle-delay is the time taken to blank the screen.
lock-delay is an additional delay before locking.
OSEv3 Node Utilisation
A quick and dirty script to query all nodes for utilisation data:-
#/bin/bash
printf "%-12s %-25s %-4s %-15s %-20s %-18s %-8s \n" "NODE" "STATE" "PODS" "CPU Req" "CPU Lim" "Memory Req" "Memory Lim"
oc get nodes --show-labels | grep user | while read NODE STAT stuff
do
printf "%-12s %-25s %-5s " $(echo $NODE | cut -f1 -d. ) $STAT $(oadm manage-node --list-pods $NODE 2> /dev/null | sed '/^NAME.*/d' | wc -l)
printf "%-7s %-7s %-7s %-12s %-12s %-5s %-12s %-5s\n" $(oc describe node $NODE | grep -a2 "CPU Requests" | tail -1)
done
Openshift: Recovery from Head Gear (or Node) Failure
This is another question that has been raised several times recently. Perhaps a node vanishes and is unrecoverable, how do we recover from the loss of a head gear? Is it possible to promote a normal gear to head status?
The simple answer appears to be … no.
The solution here is to run backups of /var/lib/openshift on all nodes.
In the case of node failure a fresh node can be built, added to the district, /var/lib/openshift restored from backup then a ‘oo-admin-regenerate-gear-metadata’ executed. This (as the name suggests) recreates metadata associated with all gears on the node. This includes gear entries in passwd/group files, cgroup rules and limits.conf.
OpenShift: Testing of Resource Limits, CGroups
Recently I’ve had two customers asking the same question.
How can we put sufficient load on a gear or node in order to demonstrate:-
a) cgroup limits
b) guaranteed resource allocation
c) ‘worst case scenario’ performance expectations
This is perhaps a reasonable question but very difficult to answer. Most of the limits in OSE are imposed by cgroups, mostly with clearly defined limits (as defined in the nodes /etc/openshift/resource_limits.conf). The two obvious exceptions are disk space (using quota) and CPU.
Whilst CPU is implemented by cgroups, this is defined in terms of shares; You can’t guarantee a gear x cpu cycles, only allocate a share and always in competition with other gears. However, by default a gear will only use one CPU core.
When trying to create a cartridge to demonstrate behavior under load, I quickly realised the openshift-watchman process is quick to throttle misbehaving gears. If during testing you see unexpected behaviour, remember to test with and without watchman running!
I took the DIY cartridge as an example and modified the start hook to start a ‘stress’ process. Environment variables can be set using rhc to specify number of CPU, VM, IO and HD threads. This cartridge does not create network load.
http://www.track3.org.uk/~steve/openshift/openshift-snetting-cartridge-stress-0.0.1-1.el6.x86_64.rpm
Collection and analysis of load/io data is left to the user.
Creating of a ‘stress’ application:-
[steve@broker ~]$ rhc app create snstress stress

Using snetting-stress-0.1 (StressTest 0.1) for 'stress'
Application Options
-------------------
Domain: steve
Cartridges: snetting-stress-0.1
Gear Size: default
Scaling: no
Creating application 'snstress' ... done
Disclaimer: Experimental cartridge to stress test a gear (CPU/IO).
Use top/iotop/vmstat/sar to demonstrate cgroup limits and watchman throttling.
STRESS_CPU_THREADS=1
STRESS_IO_THREADS=0
STRESS_VM_THREADS=0
STRESS_HD_THREADS=0
Note: To override these values use 'rhc env-set' and restart gear
See http://tinyurl.com/procgrr for Resource Management Guide
Stress testing started.
Waiting for your DNS name to be available ... done
Initialized empty Git repository in /home/steve/snstress/.git/
Your application 'snstress' is now available.
URL: http://snstress-steve.example.com/
SSH to: 55647297e3c9c34266000137@snstress-steve.example.com
Git remote: ssh://55647297e3c9c34266000137@snstress-steve.example.com/~/git/snstress.git/
Cloned to: /home/steve/snstress
Run 'rhc show-app snstress' for more details about your app.
‘top’ running on the target node (one core at 100% user):-
top - 14:19:49 up  5:50,  1 user,  load average: 0.76, 0.26, 0.11

Tasks: 139 total,   3 running, 135 sleeping,   0 stopped,   1 zombie

Cpu0  :  0.0%us,  0.0%sy,  0.0%ni, 99.7%id,  0.3%wa,  0.0%hi,  0.0%si,  0.0%st

Cpu1  :100.0%us,  0.0%sy,  0.0%ni,  0.0%id,  0.0%wa,  0.0%hi,  0.0%si,  0.0%st

Cpu2  :  0.0%us,  0.0%sy,  0.0%ni,100.0%id,  0.0%wa,  0.0%hi,  0.0%si,  0.0%st

Cpu3  :  0.0%us,  0.3%sy,  0.0%ni, 99.7%id,  0.0%wa,  0.0%hi,  0.0%si,  0.0%st

Mem:   1019812k total,   474820k used,   544992k free,    75184k buffers

Swap:   835580k total,      440k used,   835140k free,    80596k cached
Using rhc we stop the application, define some variables (add IO worker threads) and restart:-
[steve@broker ~]$ rhc app stop snstress

RESULT:

snstress stopped

[steve@broker ~]$ rhc app-env STRESS_IO_THREADS=1 --app snstress

Setting environment variable(s) ... done

[steve@broker ~]$ rhc app-env STRESS_VM_THREADS=1 --app snstress

Setting environment variable(s) ... done

[steve@broker ~]$ rhc app-env STRESS_HD_THREADS=1 --app snstress

Setting environment variable(s) ... done

[steve@broker ~]$ rhc app start snstress

RESULT:

snstress started
Check node ‘top’ again (note multiple threads):-
top - 14:23:20 up  5:54,  1 user,  load average: 0.53, 0.40, 0.20

Tasks: 142 total,   4 running, 137 sleeping,   0 stopped,   1 zombie

Cpu0  :  1.3%us,  0.3%sy,  0.0%ni, 97.7%id,  0.7%wa,  0.0%hi,  0.0%si,  0.0%st

Cpu1  :  0.7%us, 11.9%sy,  0.0%ni, 87.5%id,  0.0%wa,  0.0%hi,  0.0%si,  0.0%st

Cpu2  :  2.6%us,  7.3%sy,  0.0%ni, 86.8%id,  2.6%wa,  0.0%hi,  0.0%si,  0.7%st

Cpu3  :  6.6%us,  0.3%sy,  0.0%ni, 92.7%id,  0.0%wa,  0.0%hi,  0.0%si,  0.3%st

Mem:   1019812k total,   636048k used,   383764k free,    64732k buffers

Swap:   835580k total,      692k used,   834888k free,    68716k cached
PID USER PR NI VIRT RES SHR S %CPU %MEM TIME+ COMMAND
20637 4325 20 0 262m 198m 176 R 12.0 19.9 0:04.35 stress
20635 4325 20 0 6516 192 100 R 9.6 0.0 0:04.33 stress
20636 4325 20 0 6516 188 96 R 8.0 0.0 0:02.42 stress
Not what’s expected?
[root@node1 ~]# service openshift-watchman status

Watchman is running
Hmmm…
[root@node1 node]# tail -f /var/log/messages

May 26 15:33:55 node1 watchman[7672]: Throttler: throttle => 55647297e3c9c34266000137 (99.99)
… demonstrating watchman is doing its job! But, let’s stop watchman and let the abuse begin…
[root@node1 ~]# service openshift-watchman stop

Stopping Watchman
Top (notice high IO Wait)…
top - 14:26:46 up  5:57,  1 user,  load average: 0.70, 0.41, 0.22

Tasks: 142 total,   4 running, 137 sleeping,   0 stopped,   1 zombie

Cpu0  :  0.0%us,  5.4%sy,  0.0%ni, 23.7%id, 69.5%wa,  0.3%hi,  0.3%si,  0.7%st

Cpu1  :  0.3%us,  6.0%sy,  0.0%ni, 64.2%id, 27.8%wa,  0.0%hi,  0.7%si,  1.0%st

Cpu2  : 12.2%us,  0.0%sy,  0.0%ni, 87.1%id,  0.0%wa,  0.0%hi,  0.0%si,  0.7%st

Cpu3  :  0.7%us, 11.3%sy,  0.0%ni, 76.4%id, 10.6%wa,  0.0%hi,  0.7%si,  0.3%st

Mem:   1019812k total,   910040k used,   109772k free,    66360k buffers

Swap:   835580k total,      692k used,   834888k free,   339780k cached
PID USER PR NI VIRT RES SHR S %CPU %MEM TIME+ COMMAND
22182 4325 20 0 6516 192 100 R 12.3 0.0 0:00.70 stress
22184 4325 20 0 262m 226m 176 R 10.6 22.7 0:00.60 stress
22185 4325 20 0 7464 1264 152 R 7.3 0.1 0:00.53 stress
Further analysis can be done using vmstat, iotop, sar or your tool of preference.
If IO stops after a few seconds it’s also worth tailing your application log:-
[steve@broker ~]$ rhc tail snstress

[2015-05-26 14:25:34] INFO  going to shutdown ...

[2015-05-26 14:25:34] INFO  WEBrick::HTTPServer#start done.

stress: info: [21775] dispatching hogs: 1 cpu, 1 io, 1 vm, 1 hdd

[2015-05-26 14:25:35] INFO  WEBrick 1.3.1

[2015-05-26 14:25:35] INFO  ruby 1.8.7 (2013-06-27) [x86_64-linux]

[2015-05-26 14:25:36] INFO  WEBrick::HTTPServer#start: pid=21773 port=8080

stress: FAIL: [21780] (591) write failed: Disk quota exceeded

stress: FAIL: [21775] (394) <-- worker 21780 returned error 1
stress: WARN: [21775] (396) now reaping child worker processes
stress: FAIL: [21775] (400) kill error: No such process
I hope someone, somewhere, finds this useful :o)