
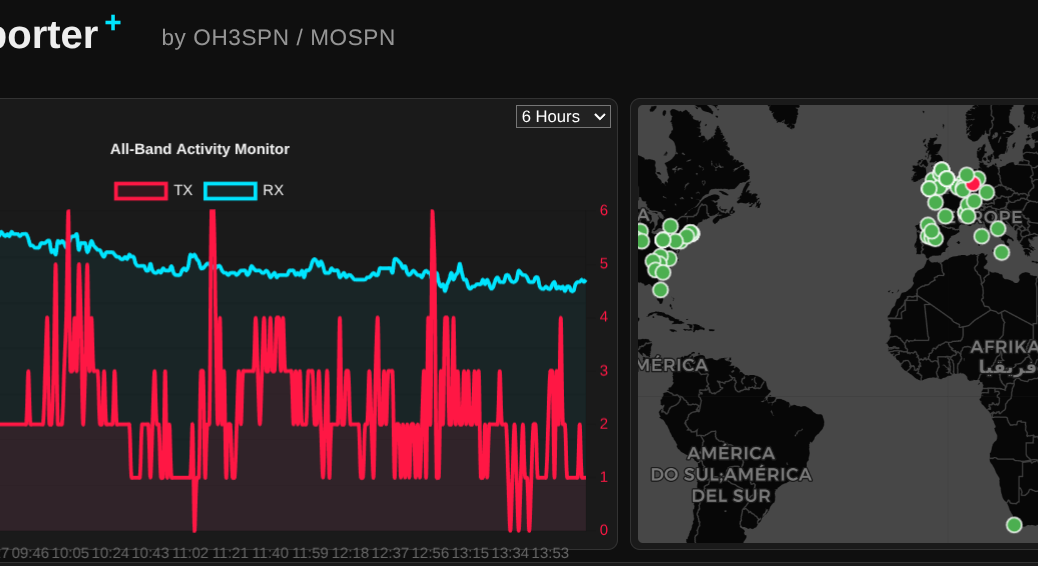
What happens when you combine an NVIDIA RTX 3060, an open-weight 14-billion parameter LLM, and a global network of amateur radio operators? You get a surprisingly perfect example of edge computing.
Continue reading From the Ham Shack to the Edge: Delivering Real Value with Local LLMsTag Archives: OpenShift

What I Learnt Giving an LLM Agent Control of My Crypto Wallet

In my role as a Senior OpenShift Technical Account Manager at Red Hat, I focus on mission-critical stability; helping organisations navigate the shift from cloud-native architectures to AI-ready operations. But there is a distinct difference between advising on a scalable MLOps workflow and trusting a local LLM to trade your own capital in a volatile market.
Would you trust an AI agent with your bank account? I did; and it was a masterclass in ‘Boom or Bust’ logic.
Continue reading What I Learnt Giving an LLM Agent Control of My Crypto Wallet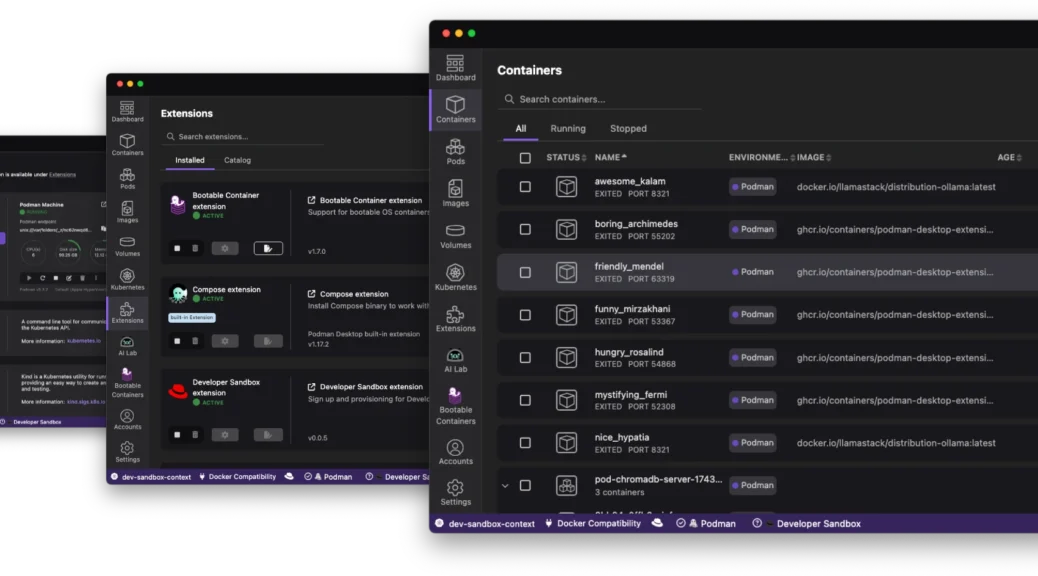
Navigating the Future of Local Development: The Red Hat Build of Podman Desktop
The “it works on my machine” excuse has officially reached its expiration date. As we move through 2026, the complexity of modern applications – often involving a mix of containers, Kubernetes manifests, and now local AI models – demands a local environment that is not just a sandbox; it is a mirror of production.
Enter the Red Hat build of Podman Desktop.
Continue reading Navigating the Future of Local Development: The Red Hat Build of Podman DesktopFrom Zero to Openshift in 30 Minutes
Discover how to leverage the power of kcli and libvirt to rapidly deploy a full OpenShift cluster in under 30 minutes, cutting through the complexity often associated with OpenShift installations.
Continue reading From Zero to Openshift in 30 MinutesOpenshift: Recovery from Head Gear (or Node) Failure
This is another question that has been raised several times recently. Perhaps a node vanishes and is unrecoverable, how do we recover from the loss of a head gear? Is it possible to promote a normal gear to head status?
The simple answer appears to be … no.
The solution here is to run backups of /var/lib/openshift on all nodes.
In the case of node failure a fresh node can be built, added to the district, /var/lib/openshift restored from backup then a ‘oo-admin-regenerate-gear-metadata’ executed. This (as the name suggests) recreates metadata associated with all gears on the node. This includes gear entries in passwd/group files, cgroup rules and limits.conf.
OpenShift: Testing of Resource Limits, CGroups
Recently I’ve had two customers asking the same question.
How can we put sufficient load on a gear or node in order to demonstrate:-
a) cgroup limits
b) guaranteed resource allocation
c) ‘worst case scenario’ performance expectations
This is perhaps a reasonable question but very difficult to answer. Most of the limits in OSE are imposed by cgroups, mostly with clearly defined limits (as defined in the nodes /etc/openshift/resource_limits.conf). The two obvious exceptions are disk space (using quota) and CPU.
Whilst CPU is implemented by cgroups, this is defined in terms of shares; You can’t guarantee a gear x cpu cycles, only allocate a share and always in competition with other gears. However, by default a gear will only use one CPU core.
When trying to create a cartridge to demonstrate behavior under load, I quickly realised the openshift-watchman process is quick to throttle misbehaving gears. If during testing you see unexpected behaviour, remember to test with and without watchman running!
I took the DIY cartridge as an example and modified the start hook to start a ‘stress’ process. Environment variables can be set using rhc to specify number of CPU, VM, IO and HD threads. This cartridge does not create network load.
http://www.track3.org.uk/~steve/openshift/openshift-snetting-cartridge-stress-0.0.1-1.el6.x86_64.rpm
Collection and analysis of load/io data is left to the user.
Creating of a ‘stress’ application:-
[steve@broker ~]$ rhc app create snstress stress

Using snetting-stress-0.1 (StressTest 0.1) for 'stress'
Application Options
-------------------
Domain: steve
Cartridges: snetting-stress-0.1
Gear Size: default
Scaling: no
Creating application 'snstress' ... done
Disclaimer: Experimental cartridge to stress test a gear (CPU/IO).
Use top/iotop/vmstat/sar to demonstrate cgroup limits and watchman throttling.
STRESS_CPU_THREADS=1
STRESS_IO_THREADS=0
STRESS_VM_THREADS=0
STRESS_HD_THREADS=0
Note: To override these values use 'rhc env-set' and restart gear
See http://tinyurl.com/procgrr for Resource Management Guide
Stress testing started.
Waiting for your DNS name to be available ... done
Initialized empty Git repository in /home/steve/snstress/.git/
Your application 'snstress' is now available.
URL: http://snstress-steve.example.com/
SSH to: 55647297e3c9c34266000137@snstress-steve.example.com
Git remote: ssh://55647297e3c9c34266000137@snstress-steve.example.com/~/git/snstress.git/
Cloned to: /home/steve/snstress
Run 'rhc show-app snstress' for more details about your app.
‘top’ running on the target node (one core at 100% user):-
top - 14:19:49 up  5:50,  1 user,  load average: 0.76, 0.26, 0.11

Tasks: 139 total,   3 running, 135 sleeping,   0 stopped,   1 zombie

Cpu0  :  0.0%us,  0.0%sy,  0.0%ni, 99.7%id,  0.3%wa,  0.0%hi,  0.0%si,  0.0%st

Cpu1  :100.0%us,  0.0%sy,  0.0%ni,  0.0%id,  0.0%wa,  0.0%hi,  0.0%si,  0.0%st

Cpu2  :  0.0%us,  0.0%sy,  0.0%ni,100.0%id,  0.0%wa,  0.0%hi,  0.0%si,  0.0%st

Cpu3  :  0.0%us,  0.3%sy,  0.0%ni, 99.7%id,  0.0%wa,  0.0%hi,  0.0%si,  0.0%st

Mem:   1019812k total,   474820k used,   544992k free,    75184k buffers

Swap:   835580k total,      440k used,   835140k free,    80596k cached
Using rhc we stop the application, define some variables (add IO worker threads) and restart:-
[steve@broker ~]$ rhc app stop snstress

RESULT:

snstress stopped

[steve@broker ~]$ rhc app-env STRESS_IO_THREADS=1 --app snstress

Setting environment variable(s) ... done

[steve@broker ~]$ rhc app-env STRESS_VM_THREADS=1 --app snstress

Setting environment variable(s) ... done

[steve@broker ~]$ rhc app-env STRESS_HD_THREADS=1 --app snstress

Setting environment variable(s) ... done

[steve@broker ~]$ rhc app start snstress

RESULT:

snstress started
Check node ‘top’ again (note multiple threads):-
top - 14:23:20 up  5:54,  1 user,  load average: 0.53, 0.40, 0.20

Tasks: 142 total,   4 running, 137 sleeping,   0 stopped,   1 zombie

Cpu0  :  1.3%us,  0.3%sy,  0.0%ni, 97.7%id,  0.7%wa,  0.0%hi,  0.0%si,  0.0%st

Cpu1  :  0.7%us, 11.9%sy,  0.0%ni, 87.5%id,  0.0%wa,  0.0%hi,  0.0%si,  0.0%st

Cpu2  :  2.6%us,  7.3%sy,  0.0%ni, 86.8%id,  2.6%wa,  0.0%hi,  0.0%si,  0.7%st

Cpu3  :  6.6%us,  0.3%sy,  0.0%ni, 92.7%id,  0.0%wa,  0.0%hi,  0.0%si,  0.3%st

Mem:   1019812k total,   636048k used,   383764k free,    64732k buffers

Swap:   835580k total,      692k used,   834888k free,    68716k cached
PID USER PR NI VIRT RES SHR S %CPU %MEM TIME+ COMMAND
20637 4325 20 0 262m 198m 176 R 12.0 19.9 0:04.35 stress
20635 4325 20 0 6516 192 100 R 9.6 0.0 0:04.33 stress
20636 4325 20 0 6516 188 96 R 8.0 0.0 0:02.42 stress
Not what’s expected?
[root@node1 ~]# service openshift-watchman status

Watchman is running
Hmmm…
[root@node1 node]# tail -f /var/log/messages

May 26 15:33:55 node1 watchman[7672]: Throttler: throttle => 55647297e3c9c34266000137 (99.99)
… demonstrating watchman is doing its job! But, let’s stop watchman and let the abuse begin…
[root@node1 ~]# service openshift-watchman stop

Stopping Watchman
Top (notice high IO Wait)…
top - 14:26:46 up  5:57,  1 user,  load average: 0.70, 0.41, 0.22

Tasks: 142 total,   4 running, 137 sleeping,   0 stopped,   1 zombie

Cpu0  :  0.0%us,  5.4%sy,  0.0%ni, 23.7%id, 69.5%wa,  0.3%hi,  0.3%si,  0.7%st

Cpu1  :  0.3%us,  6.0%sy,  0.0%ni, 64.2%id, 27.8%wa,  0.0%hi,  0.7%si,  1.0%st

Cpu2  : 12.2%us,  0.0%sy,  0.0%ni, 87.1%id,  0.0%wa,  0.0%hi,  0.0%si,  0.7%st

Cpu3  :  0.7%us, 11.3%sy,  0.0%ni, 76.4%id, 10.6%wa,  0.0%hi,  0.7%si,  0.3%st

Mem:   1019812k total,   910040k used,   109772k free,    66360k buffers

Swap:   835580k total,      692k used,   834888k free,   339780k cached
PID USER PR NI VIRT RES SHR S %CPU %MEM TIME+ COMMAND
22182 4325 20 0 6516 192 100 R 12.3 0.0 0:00.70 stress
22184 4325 20 0 262m 226m 176 R 10.6 22.7 0:00.60 stress
22185 4325 20 0 7464 1264 152 R 7.3 0.1 0:00.53 stress
Further analysis can be done using vmstat, iotop, sar or your tool of preference.
If IO stops after a few seconds it’s also worth tailing your application log:-
[steve@broker ~]$ rhc tail snstress

[2015-05-26 14:25:34] INFO  going to shutdown ...

[2015-05-26 14:25:34] INFO  WEBrick::HTTPServer#start done.

stress: info: [21775] dispatching hogs: 1 cpu, 1 io, 1 vm, 1 hdd

[2015-05-26 14:25:35] INFO  WEBrick 1.3.1

[2015-05-26 14:25:35] INFO  ruby 1.8.7 (2013-06-27) [x86_64-linux]

[2015-05-26 14:25:36] INFO  WEBrick::HTTPServer#start: pid=21773 port=8080

stress: FAIL: [21780] (591) write failed: Disk quota exceeded

stress: FAIL: [21775] (394) <-- worker 21780 returned error 1
stress: WARN: [21775] (396) now reaping child worker processes
stress: FAIL: [21775] (400) kill error: No such process
I hope someone, somewhere, finds this useful :o)
OSE 2.x Support Node (MongoDB) Firewall
This is effectively a ‘reverse firewall’; allow everything *except* connections to MongoDB. A connection to Mongo without authentication can do little more than query the MongoDB db.version() however some still consider this a security risk.
#!/bin/bash -x

#

# Script to firewall Openshift Support (Mongo) Nodes

# 21/04/15 snetting
IPTABLES=/sbin/iptables
# Add all brokers and support nodes here (use FQDNs)
OSE_HOSTS="broker1.domain
broker2.domain
supportnode1.domain
supportnode2.domain"
# Convert to IPs and add localhost
MONGO_IPS=$(dig $OSE_HOSTS +short)
MONGO_IPS="$(echo $MONGO_IPS | tr ' ' ','),127.0.0.1"
# Add iptables ACCEPT rules
$IPTABLES -A INPUT -p tcp -s $MONGO_IPS --destination-port 27017 -j ACCEPT
# Add iptables REJECT (port 27017)
$IPTABLES -A INPUT -p tcp --destination-port 27017 -j REJECT