

The modern inbox is frequently a wasteland of unanswered queries, automated noise, and chaotic requests that require three follow-up emails just to establish the basic facts. While corporate giants throw massive, energy-hungry models at this problem, there is a far more elegant, “old-school meets new-school” solution brewing on the command line. By combining the rock-solid reliability of Unix mail tools with the nuanced reasoning of a 14b parameter Large Language Model, it is possible to build a digital front-desk that does not just acknowledge receipt, but actually thinks.
Continue reading The Gatekeeper in the Machine: Taming the Inbox with Local LLMsCategory Archives: linux

Beyond the Dashboard: How a 14B LLM Brought Real Intelligence to My Server Monitoring
If you manage Linux servers, you already know the morning ritual. You sip your coffee and stare at your monitoring dashboards. Grafana, Zabbix, Datadog – pick your poison. They are excellent at showing you lines on a graph, but let’s be honest; traditional monitoring is fundamentally “dumb.”
Standard monitoring relies on rigid thresholds. If CPU usage hits 95%, you get an alert. But what if that 95% CPU usage is just the scheduled weekly backup running alongside a routine malware scan? Your dashboard doesn’t care. It fires off an alert anyway, contributing to the slow, inevitable creep of alert fatigue.
I wanted something better. I didn’t just want monitoring; I wanted monitoring plus intelligence.
Continue reading Beyond the Dashboard: How a 14B LLM Brought Real Intelligence to My Server Monitoring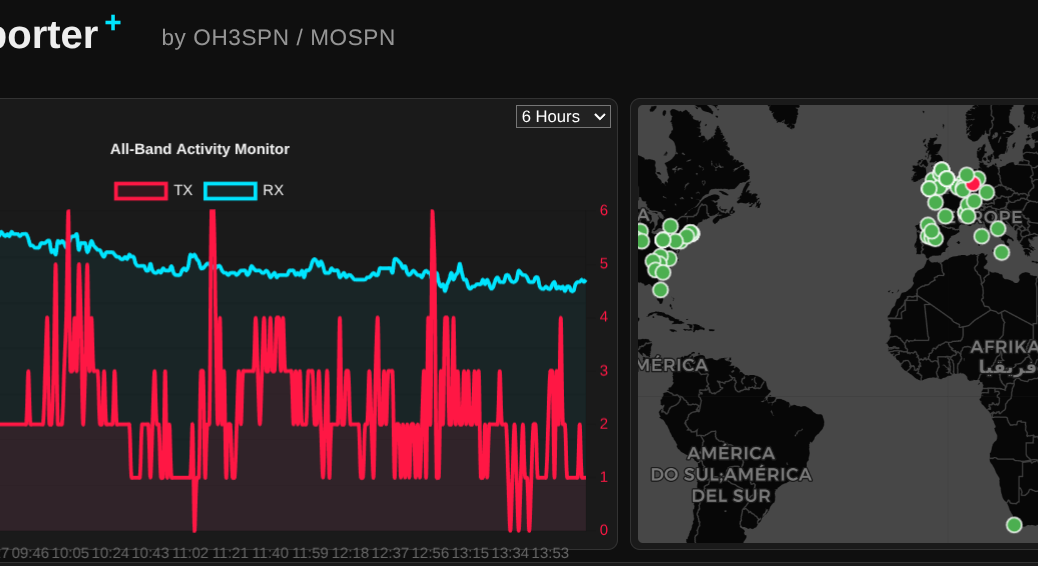
From the Ham Shack to the Edge: Delivering Real Value with Local LLMs
What happens when you combine an NVIDIA RTX 3060, an open-weight 14-billion parameter LLM, and a global network of amateur radio operators? You get a surprisingly perfect example of edge computing.
Continue reading From the Ham Shack to the Edge: Delivering Real Value with Local LLMs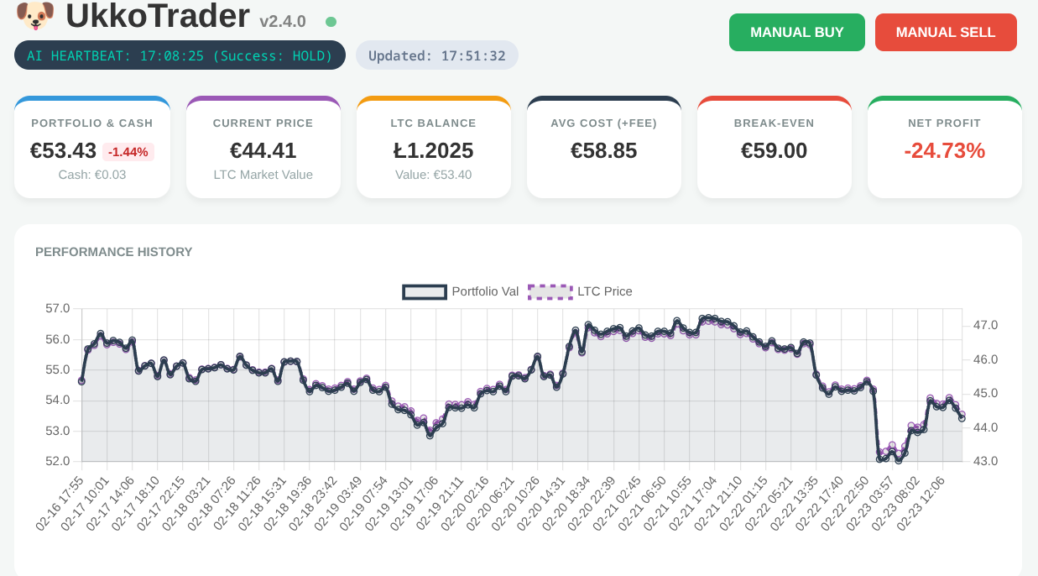
What I Learnt Giving an LLM Agent Control of My Crypto Wallet
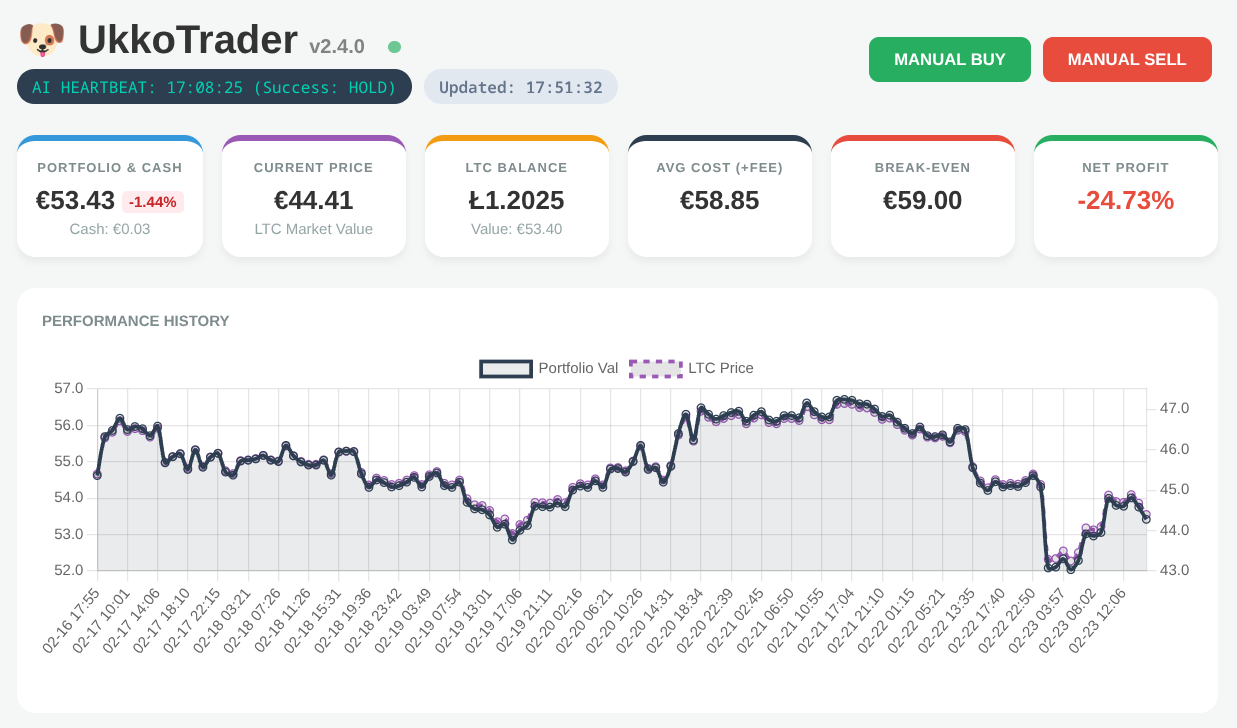
In my role as a Senior OpenShift Technical Account Manager at Red Hat, I focus on mission-critical stability; helping organisations navigate the shift from cloud-native architectures to AI-ready operations. But there is a distinct difference between advising on a scalable MLOps workflow and trusting a local LLM to trade your own capital in a volatile market.
Would you trust an AI agent with your bank account? I did; and it was a masterclass in ‘Boom or Bust’ logic.
Continue reading What I Learnt Giving an LLM Agent Control of My Crypto Wallet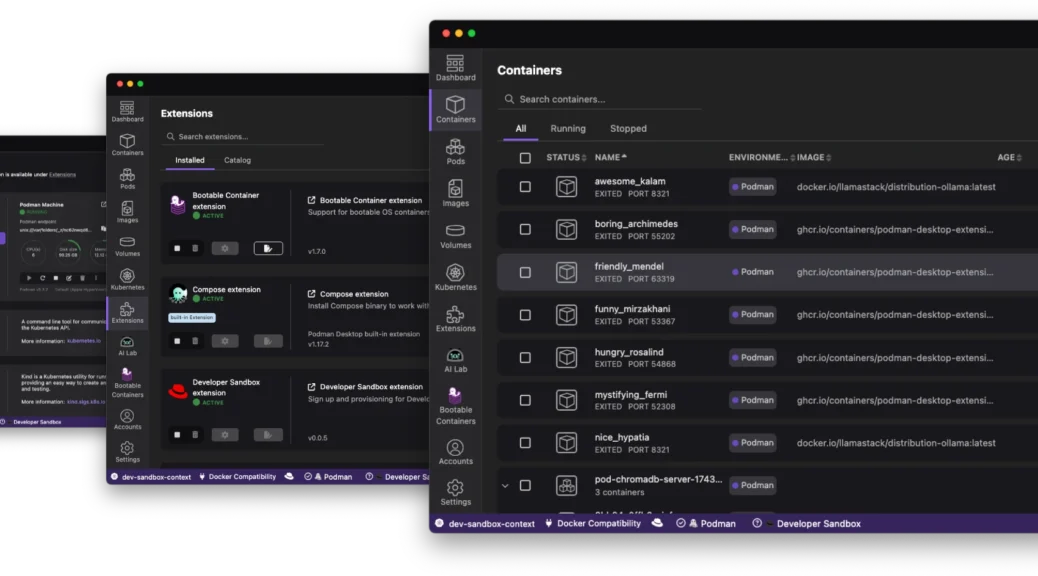
Navigating the Future of Local Development: The Red Hat Build of Podman Desktop
The “it works on my machine” excuse has officially reached its expiration date. As we move through 2026, the complexity of modern applications – often involving a mix of containers, Kubernetes manifests, and now local AI models – demands a local environment that is not just a sandbox; it is a mirror of production.
Enter the Red Hat build of Podman Desktop.
Continue reading Navigating the Future of Local Development: The Red Hat Build of Podman Desktop
Fedora 42 Meets CUDA 12.9: The Quest to Build vllm (InstructLab)
Over the past couple of weeks I’ve been wrestling with building vllm (with CUDA support) under Fedora 42. Here’s the short version of what went wrong:-
Continue reading Fedora 42 Meets CUDA 12.9: The Quest to Build vllm (InstructLab)Stable Diffusion on cpu

AKA “Stable Diffusion without a GPU” 🙂
Currently, the ‘Use CPU if no CUDA device detected’ [1] pull request has not merged. Following the instructions at [2] and jumping down the dependency rabbit hole, I finally have Stable Diffusion running on an old dual XEON server.
[1] https://github.com/CompVis/stable-diffusion/pull/132
[2] https://github.com/CompVis/stable-diffusion/issues/219
Server specs:-
Fujitsu R290 Xeon Workstation
Dual Intel(R) Xeon(R) CPU E5-2670 @ 2.60GHz
96 GB RAM
SSD storage
Sample command line:-
time python3.8 scripts/txt2img.py --prompt "AI image creation using CPU" --plms --ckpt sd-v1-4.ckpt --H 768 --W 512 --skip_grid --n_samples 1 --n_rows 1 --ddim_steps 50Initial tests show the following:-
| Resolution | Steps | RAM (GB) | Time (minutes) |
| 768 x 512 | 50 | ~10 | 15 |
| 1024 x 768 | 50 | ~30 | 24 |
| 1280 x 1024 | 50 | ~65 | 66 |
| 1536 x 1280 | 50 | OOM | N/A |
Notes:
1) Typically only 18 (out of 32 cores) active regardless of render size.
2) As expected, the calculation is entirely CPU bound.
3) For an unknown reason, even with –n_samples and –n_rows of 1, two images were still created (time halved for single image in above table).

Conclusion:
It works. We gain resolution at the huge expense of memory and time.
AmigaOS4.1 (PPC) under FS-UAE and QEMU
I recently purchased AmigaOS 4.1 with a plan to familiarise myself with the OS via emulation before purchasing the Freescale QorIQ P1022 e500v2 ‘Tabor’ motherboard. In particular, I wanted to investigate the ssh and X display options, including AmiCygnix.

However, despite being familiar with OS3.1 and FS-UAE I still managed to hit a few gotchas with the OS4 install and configuration.
Installation of the QEMU module was simple using the download and simple instructions from: https://fs-uae.net/download#plugins. In my case this was version 3.8.2qemu2.2.0 and installed in ~/Documents/FS-UAE/Plugins/QEMU-UAE/Linux/x86-64/ (your path may vary).
I then tried multiple FS-UAE configurations in order to get the emulated machine to boot with PPC, RTG and network support. A few options clash resulting in a purple screen on boot. Rather than work through the process from scratch, it’s easier to simply list my config here:-
[fs-uae]
accelerator = cyberstorm-ppc
amiga_model = A4000/OS4
gfx_card_flash_file = /home/snetting/Documents/FS-UAE/Kickstarts/picasso_iv_flash.rom
graphics_card = picasso-iv
graphics_memory = 131072
hard_drive_0 = /home/snetting/Amiga/SteveOS41.hdf
kickstart_file = Kickstart v3.1 rev 40.70 (1993)(Commodore)(A4000).rom
network_card = a2065
zorro_iii_memory = 524288
I used FS-UAE (and FS-UAE-Launcher) version 2.8.3.
Things to note:
- See http://eab.abime.net/showthread.php?t=75195 for install advice regarding disk partitioning and FS type. This is important!
- Shared folders (between host OS and Emulation) are *not* currently supported when using PPC under FS-UAE. Post install, many additional packages were required, including network drivers which resulted in a catch-22 situation. I worked around this by installing a 3.1.4 instance and mounting both the OS4 and ‘shared’ drives here, copying the required files over then booting back into the OS4 PPC environment.
- For networking, UAE.bsdsocket.library in UAE should be disabled but the A2065 network card enabled. The correct driver from aminet is: http://aminet.net/package/driver/net/Ethernet
- The latest updates to OS4.1 (final) enable Zorro III RAM to be used in addition to accelerator RAM; essential for AmiCygnix. Once OS4.1 is installed and network configured, use the included update tool to pull OS4.1 FE updates.
The documentation at http://eab.abime.net/showthread.php?t=75195 is definitely useful as a reference but don’t rely on it; it’s dated (2014) and not necessarily accurate.
Whilst I’ve written this from memory, I’ll happily recreate my install from scratch if anyone has any specific questions or issues.
Good luck!
ROMs are available from Cloanto: https://www.amigaforever.com/
OS4.1 and updates from Hyperion: https://www.amigaos.net/
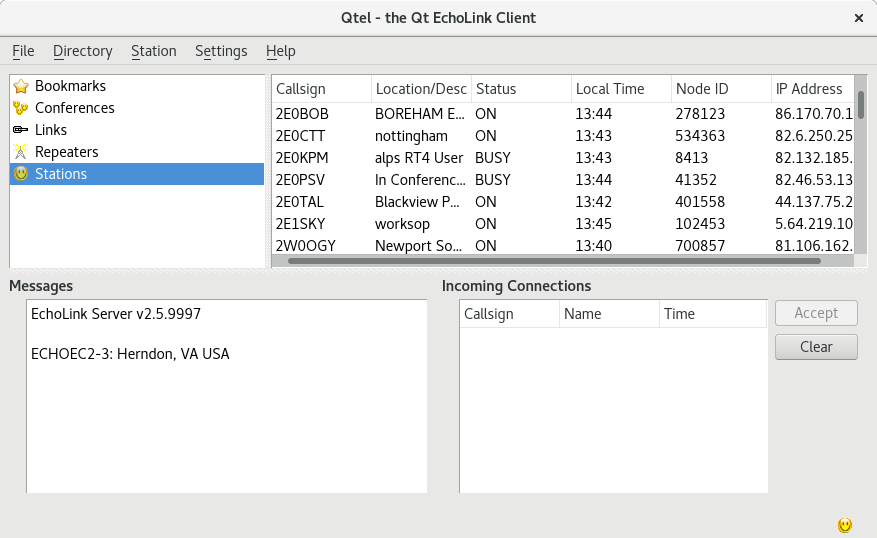
Building qtel (Echolink client) under Fedora Linux
With both my previous bad experience building qtel (the Linux EchoLink client) and recent discussions on a forum around similar difficulties – I thought I’d identify, resolve and document the issues.
I’m not sure what’s changed but the process is now very simple (Fedora 28):-
git clone https://github.com/sm0svx/svxlink.git

cd svxlink/

cd src

sudo dnf install cmake libsigc++20-devel qt-devel popt-devel libgcrypt-devel gsm-devel tcl-devel

cmake .

make

cp bin/qtel DESTINATION_PATH_OF_CHOICE
Depending on libs already installed, additional packages may be required – as indicated by failures during the ‘cmake’ stage.
GlusterFS / VG Metrics in Prometheus (OCP)
We had a requirement to gather LVM (VG) metrics via Prometheus to alert when GlusterFS is running low on ‘brick’ storage space. Currently, within Openshift 3.9 the only metrics seem to relate to mounted FS. A ‘heketi exporter module’ exists but this only reports space within allocated blocks. There doesn’t appear to be any method to pull metrics from the underlying storage.
We solved this by using a Prometheus pushgateway. Metrics are pushed from Gluster hosts using curl (via cron) and then pulled using a standard Prometheus scrape configuration (via prometheus configmap in OCP). Alerts are then pushed via alertmanager and eventually Cloudforms.
Import the pushgateway image:
oc import-image openshift/prom-pushgateway --from= docker.io/prom/pushgateway --confirm
Create pod and expose route. Then, add scrape config to prometheus configmap:-
    - job_name: openshift-pushgateway

      scrape_interval: 30s

      scrape_timeout: 30s

      metrics_path: /metrics

      scheme: http

      static_configs:

      - targets:

        - pushgateway-route.example.com
On GlusterFS hosts we then gather metrics in whatever way we like and push to the gateway via curl. Example:-
echo "VG_Gluster 42" | curl --data-binary @- http://pushgateway-route.example.com/metrics/job/pv_mon/pv/vg"
The metrics are then visible via prometheus UI / Grafana and alerts via alertmanager and CFME respectively.